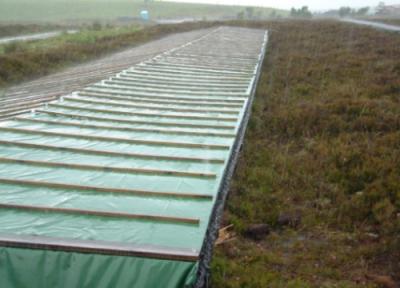
The wet treatments consist of 44 plots, each with an area of 12.5 m2. Each treatment has 4 replicates, randomised in 4 blocks on the site. Treatments are supplied at three doses of N; 8, 24 and 56 kg N ha-1 y-1, on top of the ambient deposition of 8 kg N ha-1 yr-1, in both oxidised form as NaNO3 and reduced form as NH4Cl. The yearly input is estimated as the amount of the treatment plus the ambient deposition of 8 kg Nha-1 yr-1. Additional treatments at 8 and 56 kg N (oxidised and reduced) inputs are supplemented with P and K by adding K2HPO4 at 1:14 PN ratio.
Figure (1): Schematic diagram showing the wet treatment plots at Whim bog
To supply the wet treatments, rainfall is collected on site on a 178 m2 pitched surface and stored in a 1250 litre reservoir. The rainwater is pumped through a network of pipes, dosed with the appropriate N form and concentration, and sprayed onto the experimental plots. Spraying only occurs when the wind speed is below 5 m s-1. This results in realistic doses and frequencies, which allows us to study the cumulative effects of N deposition in its different forms. Wet treatments are closed down during freezing conditions and re-activated when night temperatures rise above 0oC.


Figures: (1) Sprayer in action; (2) Rain collector in action
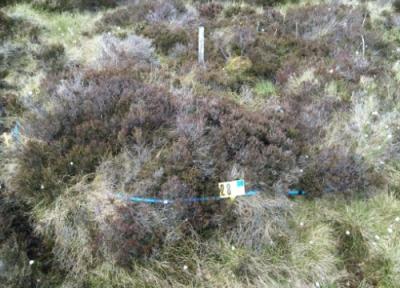
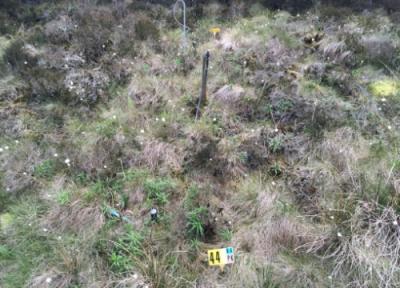
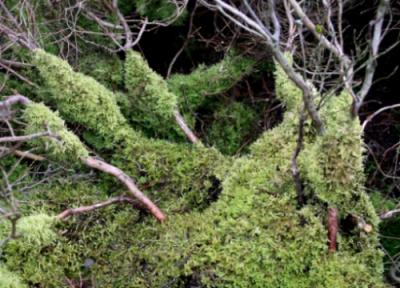
Few direct effects from the wet N deposition treatments have been identified since the start of the experiment. Therefore it is likely that ecosystem and species damage are occurring on a longer time scale compared to the dry deposition treatment. In contrast, the combined N and PK treatments have had profound changes to the species composition within the plots with, most notably, decreases in Calluna vulgaris, Sphagnum sp. and Cladonia sp.; with invasion and expansion of nitrophiles (nitrogen-loving species), non-characteristic bog plants e.g. Epilobium angustifolium, Epilobium palustre and Juncus effuses (Sheppard et al., 2013). This may cause changes in plant cover, peat chemistry and decomposition rates.


Figures: (1) Control plot; (2) NO3 treatment plot; (3) Impacted N PK treatment plot


Figures: (1) Moss expansion in N PK plot; (2) Pleurococcus expansion in N PK plots


